/ INSIDE RANKD / THE VISION

The Vision.

Every industry hits a moment when its data outgrows its tools. That's when the next industry-defining product gets built.

In December 1982, Bloomberg launched the Terminal. In 2026, that same moment has arrived for prediction markets. We are what comes next.

Scroll
PT—01 / 06

Introduction

Two Inflection Points. Forty-Four Years Apart.

If you have watched markets over the past two years, you have felt something shifting. Information itself is being repriced. The signals that used to live on cable news, in polling memos, and inside the heads of Beltway analysts are now being settled, in real time, by capital. A new asset class has emerged, and like every new asset class before it, it has emerged faster than the infrastructure built to navigate it.

Polymarket cleared $26.2 billion in Q1 2026. March 2026 alone crossed $10 billion for the first time in industry history. Kalshi is CFTC-regulated and growing. The parent company of the NYSE invested $2 billion in Polymarket at an $8 billion valuation in October 2025. Institutional money is no longer watching from the sidelines; it has arrived.

And yet, the average trader navigating these markets is doing so with the same tools available to a Reddit user in 2021: a browser tab, a Discord channel, a Twitter feed, and a gut feeling.

This is not a sustainable equilibrium. It never has been. Every time the volume of an emerging market has outpaced the tooling around it, the same thing has happened: someone builds the layer that turns chaos into a workflow. In commodities, it was the ticker tape. In equities, it was Quotron. In fixed income, it was Bloomberg.

In prediction markets, it has not happened yet. That is what Rankd is building.

"The most valuable commodity I know of is information."

— Gordon Gekko, Wall Street, 1987 — five years after the Terminal shipped.
[FIG.1]
Vintage Bloomberg Terminal on display at the Museum of the City of New York
VINTAGE BLOOMBERG TERMINAL / MUSEUM OF THE CITY OF NEW YORK / THE ORIGINAL HARDWARE THAT SHIPPED TO MERRILL LYNCH, DECEMBER 1982. PHOTO: PAUL LOWRY · CC BY 4.0.
PT—02 / 06

How We Got Here

1982: The Year Finance Outgrew Its Tools.

To understand where prediction markets are in 2026, you have to understand where finance was in 1982.

The American equities market was emerging from a fifteen-year malaise. The Dow had spent the entire 1970s trapped between 600 and 1,000 points. Inflation was double-digit. Pension funds were dumping stocks for bonds. By August 1982, the bull market that would define the next two decades was just beginning, and almost no one realized it.

Underneath the surface, the market was bigger, faster, and more fragmented than its infrastructure could handle. The NYSE, the AMEX, NASDAQ's new electronic dealer network, and regional exchanges in Boston, Philadelphia, and the Pacific were each pricing the same securities at slightly different levels, at slightly different speeds, through slightly different protocols. There was no real-time, multi-venue view of anything. A trader who wanted to know the best bid on IBM had to call four desks.

Bond pricing was worse. Treasury yields were public, but corporate bond spreads, municipal pricing, and the entire over-the-counter universe lived inside the heads, and Rolodexes, of dealer salespeople. The buyer almost never saw the spread. Information asymmetry was the business model.

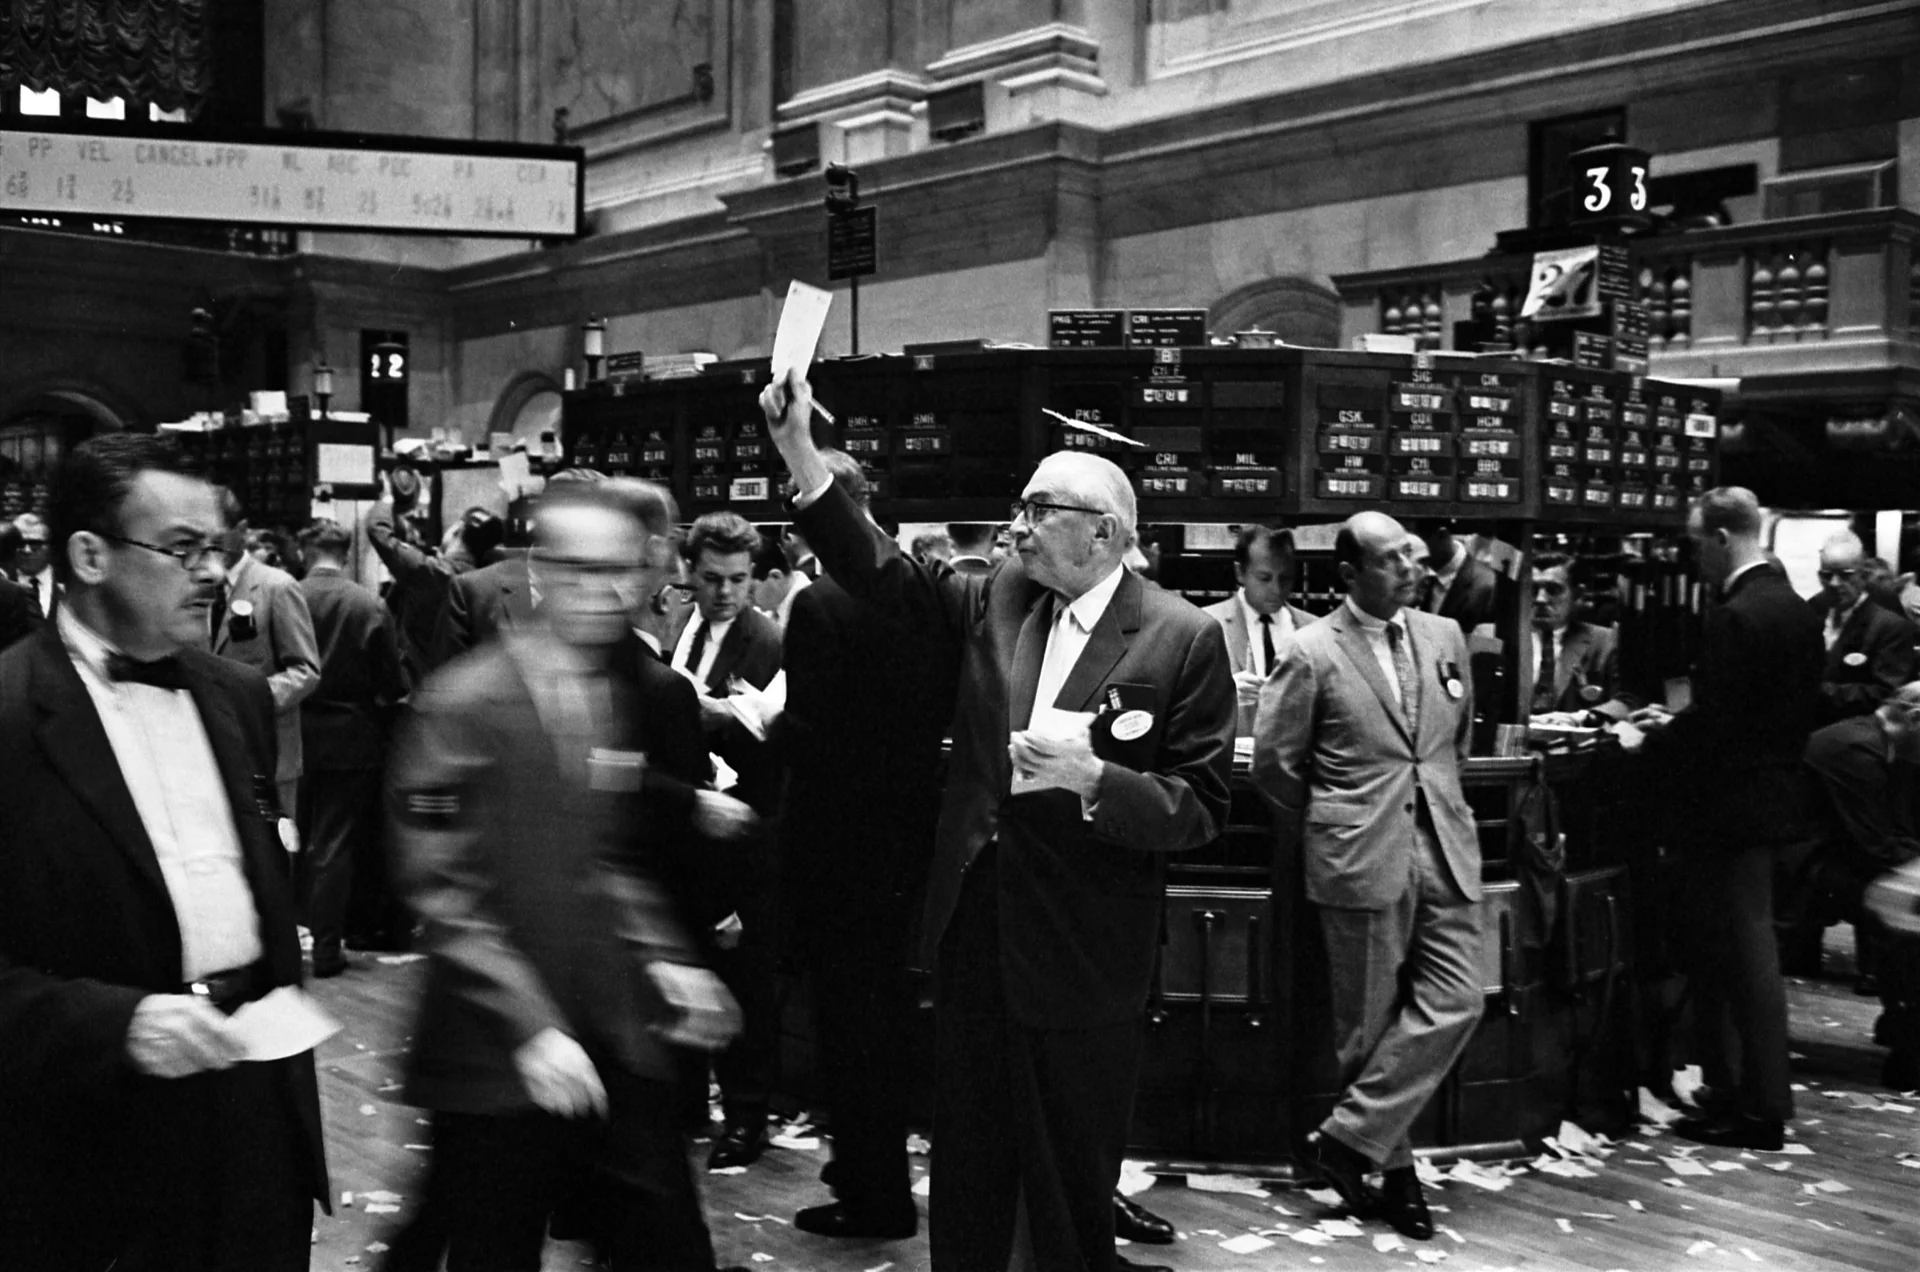
The trading floor itself was an analog system. Paper tickets. Runners. Telephones. A bond trader at Salomon Brothers in 1981 could not see what a bond trader at Goldman was bidding on the same CUSIP without making a call. The "wire," Reuters and Dow Jones, gave you headlines, but headlines are not prices.

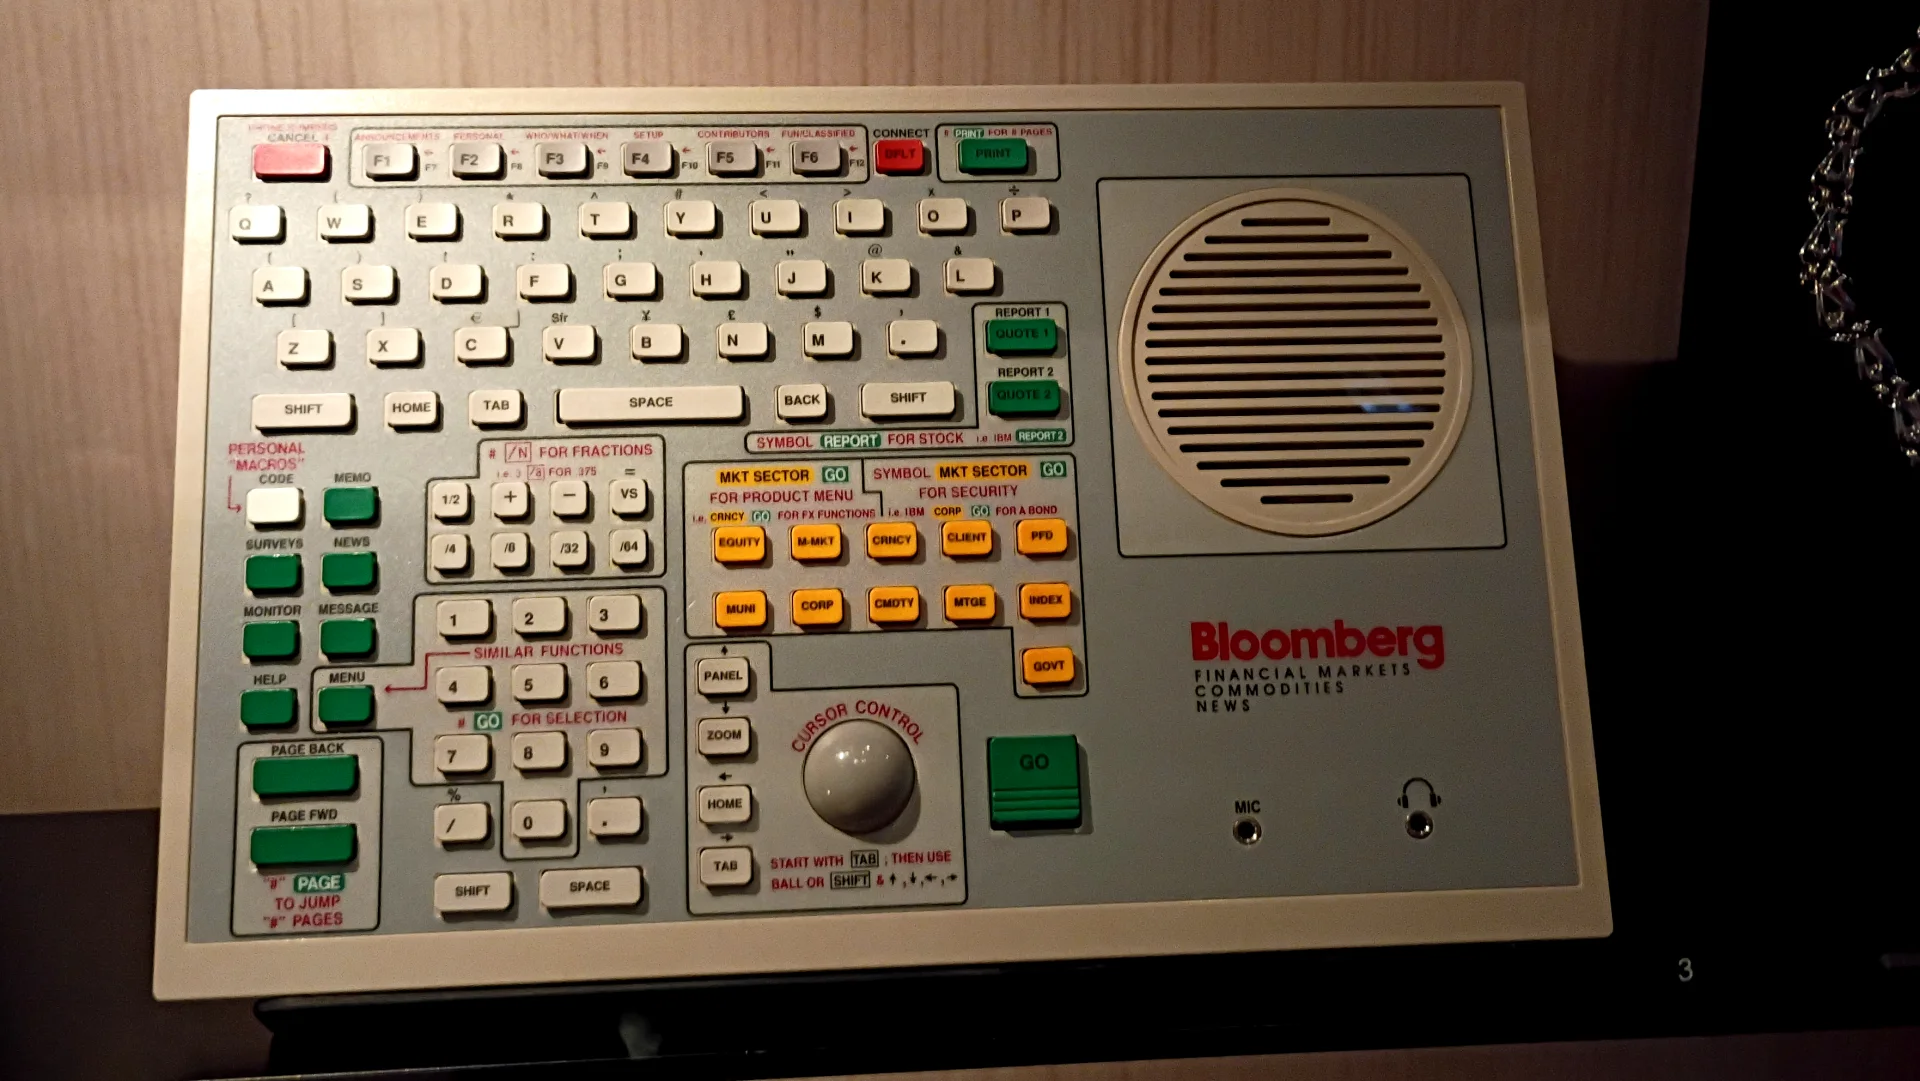
And then, in December 1982, Michael Bloomberg delivered the first Market Master Terminal to Merrill Lynch.

[FIG.2]
New York Stock Exchange traders on the floor, 1963
NYSE TRADERS FLOOR, 1963 / THE ANALOG SYSTEM WAS UNCHANGED FOR DECADES / PAPER TICKETS. RUNNERS. ROTARY PHONES. PHOTO: THOMAS J. O'HALLORAN, U.S. NEWS & WORLD REPORT · LIBRARY OF CONGRESS (PUBLIC DOMAIN).

The Terminal did not invent any new data. Every price it served already existed somewhere, on an exchange tape, in a dealer's notebook, in a regulatory filing. What it did was assemble that data into a single decision-support layer with a keyboard, a query syntax, and an answer in under a second.

That was the entire innovation. The market had outgrown its tools, and Bloomberg simply built the tool the market already needed.

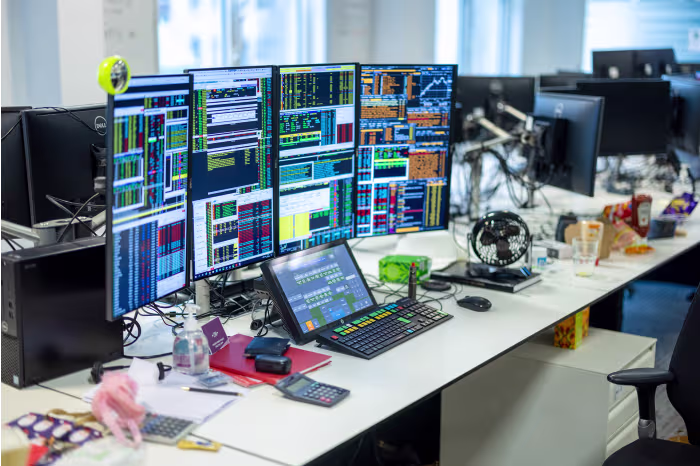
By 1990, there were 10,000 Terminals on Wall Street. By 2000, 150,000. By 2026, 325,000 subscribers across 73 countries are processing 60 billion data points a day through Bloomberg's infrastructure. The Terminal did not just serve finance; it became the central nervous system of the entire industry. Traders, analysts, journalists, regulators, central bankers, every meaningful actor in global capital markets transacts on top of the same primitive.

That is what happens when a market outgrows its tools, and the right company shows up in the right year.

PT—03 / 06

The Parallels

1982 ↔ 2026

The argument for Rankd is not analogical. It is structural. The conditions that produced demand for Bloomberg in 1982 are the same conditions that exist in prediction markets today: venue fragmentation, information asymmetry, an underserved retail base, sudden volume growth, and the arrival of institutional capital. The parallel is not poetic. It is mechanical.

Markets do not get organized when they are small. They get organized when they are large enough that the cost of disorganization exceeds the cost of building the tool.

I

Venue Fragmentation

1982 — Finance

NYSE, AMEX, NASDAQ, and the regionals each priced the same securities differently. No real-time consolidated tape across all venues existed for most asset classes. Traders called four desks to find the best bid.

1982 → 2026
2026 — Rankd

Kalshi and Polymarket together account for approximately 98% of open interest in the U.S. prediction market industry. They run on different protocols, different settlement mechanisms, different liquidity profiles, and critically, different prices on the same underlying question. No unified view exists.

II

Analog Workflow on a Digital Substrate

1982 — Finance

The data was electronic where it existed at all, but the workflow was paper, phone, and runner. There was no decision-support layer sitting above the data.

1982 → 2026
2026 — Rankd

The APIs exist. Both Kalshi and Polymarket expose real-time market data. But no decision-support layer sits above them. Retail traders manage their entire workflow through browser tabs, Discord servers, and screenshots in group chats. The data is digital. The workflow is not.

III

The Compute Gap

1982 — Finance

The asymmetry was purely access. The dealer desk had the bond spread; the retail buyer did not. Wall Street won by hoarding data.

1982 → 2026
2026 — Rankd

The asymmetry has mutated from access to processing. The data itself is public—news breaks on X instantly for everyone. But institutional desks deploy bespoke multi-agent AI pipelines that read, parse, and re-price that news in milliseconds. The retail trader is fighting supercomputers with a browser tab and a gut feeling. The gap is no longer access; it is compute. Rankd democratizes the compute.

IV

Sudden Volume Growth

1982 — Finance

Average daily NYSE volume was roughly 65 million shares in 1982. By 1992 it had tripled. By 2002 it was over a billion. The bull market that began in August 1982 was the largest sustained equity expansion in modern history.

1982 → 2026
2026 — Rankd

Polymarket cleared $26.2 billion in Q1 2026. March 2026 alone crossed $10 billion in monthly volume for the first time in industry history. Kalshi reported record contract volume across political, economic, and event categories. The curve is not linear. It is the same curve.

V

A Wider, Earlier Audience

1982 — Finance

The Terminal was built for Wall Street professionals, institutional traders, portfolio managers, analysts. Retail discount brokerage existed but was not the target user.

1982 → 2026
2026 — Rankd

The audience is wider, and it is here earlier. Retail traders dominate participation by user count, while emerging institutional money, hedge funds, market makers, and ICE itself, is increasingly setting the tape. A single product must serve both populations.

VI

The Regulatory Threshold Is Crossed

1982 — Finance

The SEC had existed for nearly 50 years. Equity markets were well-supervised. Most OTC markets, bonds, derivatives, remained opaque. Regulation existed; it was uneven.

1982 → 2026
2026 — Rankd

Kalshi is fully CFTC-regulated. Polymarket received a $2B ICE investment in October 2025, a NYSE-parent institution effectively underwriting the venue. Prediction markets are no longer the wild west. They are a regulated, capitalized, institutional-grade asset class.

VII

The Scarcity Inversion

1982 — Finance (Starvation)

The market suffered from data starvation. Information was locked inside physical Rolodexes, proprietary ledgers, and the minds of floor traders. Bloomberg's massive innovation was aggregation—going out into the dark, finding the numbers, and pulling them onto one screen. If you had the data, you won.

1982 → 2026
2026 — Rankd (Obesity)

Today, the problem has inverted. The modern trader suffers from data obesity. Open APIs, algorithmic feeds, and social media provide an infinite, paralyzing stream of noise. You don't need more information; you need a filter. Aggregation is now a commodity. The new scarcity is synthesis.

VIII

From Narrative to Accountability

1982 — Finance

Pre-Terminal Wall Street was a narrative machine. Trades were driven by stock tips, slow-moving macroeconomic newsletters, and the clubby "gut feelings" of floor traders. Bloomberg introduced cold, queryable math. It killed the "trust me" trade.

1982 → 2026
2026 — Rankd

Before prediction markets scaled, global events were analyzed purely through narrative: cable news pundits, biased polling memos, and algorithmic Twitter outrage—none of whom pay a penalty for being wrong. Prediction markets introduced the math, forcing opinions to be backed by capital. Rankd is the dashboard that tracks that math. We are transitioning from the "Opinion Era" to the "Settlement Era."

Eight structural parallels. Eight conditions that produced demand for Bloomberg in 1982. Eight conditions that exist in prediction markets today. The Terminal was inevitable in retrospect. So is what comes next.

PT—04 / 06

Why Others Won't

The Bloomberg Problem.

A reasonable question: if the parallel is this clean, why doesn't Bloomberg simply build it? Or Kalshi, or Polymarket, or any of the existing players?

The same question was asked in 1982. Reuters had a financial data product. Quotron was already serving 50,000 brokers. Dow Jones owned the wire. Why didn't they build the Terminal?

The answer then is the answer now: the incumbents are built around the workflow that exists, not the workflow that's coming.

A

The Exchanges Are Venues, Not Synthesis Layers

Kalshi and Polymarket are venues. Their ultimate product is liquidity. They have zero incentive to show a user that the contract they are about to buy is priced better on a rival exchange. A unified, cross-venue view is an existential threat to an exchange's walled garden. They will never build the tool that helps you leave their site. A unified view is an act of treason to an exchange. To Rankd, it's the entire product.

B

Institutional AI Pipelines Are Not Productized

The pipelines that hedge funds and prop shops run on event data are bespoke, expensive, and behind firewalls. They are not productized. They are not designed for the retail trader, the analyst, the journalist, or the curious institutional allocator. They are designed for a desk of twelve quants and a Bloomberg Terminal sitting next to a Linux box.

C

Retail Tools Are Community, Not Infrastructure

Discord servers, Twitter aggregators, screenshot threads: these produce signal in flashes. They do not produce a workflow. And Bloomberg itself? Bloomberg is a finance product built for finance professionals at $30,000 a seat per year. It will not, and arguably should not, retool itself for an asset class whose median user is a 28-year-old trading from a phone.

The gap is structural. The tool that solves it has to be purpose-built.

[FIG.4]
Bloomberg Terminal in use at Singer Capital Markets, London.
BLOOMBERG TERMINAL, SINGER CAPITAL MARKETS LONDON / 325,000 SUBSCRIBERS / $30,000 PER SEAT / BUILT FOR FINANCE PROFESSIONALS, NOT FOR THE NEXT ASSET CLASS. PHOTO: JASON ALDEN · BLOOMBERG · GETTY IMAGES.
PT—05 / 06

What Rankd Is

The Decision-Support Layer.

Rankd is the layer that should already exist between a prediction market trader and their data.

It is built on four principles. Each one is a direct lesson from what the Terminal got right in 1982, translated into the workflow of a 2026 user.

[FIG.3]
The Rankd dashboard open on a laptop on a desk — the four-lens view: Sharpest Edge, Highest Conviction, Fresh Catalysts, Resolves Soon
THE RANKD DASHBOARD. SIMPLY POWERFUL.

Unified View Across Venues

The first thing the Terminal did was put every price for every security on one screen. The first thing Rankd does is put every market, across Kalshi, Polymarket, and every relevant venue, into a single, comparable, queryable surface. Same question, both prices, the spread, the volume, the liquidity. One screen.

The retail trader stops switching tabs. The institutional trader stops paying a quant to write a scraper. The journalist stops screenshotting two sites side by side. The market becomes legible.

Institutional-Grade Synthesis, Built For Everyone

The Terminal's second move was to take data that already existed, earnings, news, indicators, and synthesize it into a queryable workflow that a human could use in under a second. IBM <EQUITY> GO. Done.

Rankd does the same for events. News ingestion, probability decomposition, scenario modeling, automated re-pricing as the world changes: the kind of pipeline that today only lives behind a hedge fund firewall, rendered into a workflow that the median user can run on their phone.

We are not building a research terminal. We are building the decision-support layer.

Built For How People Use Software In 2026

The Terminal in 1982 was a marvel of its medium: a monochrome CRT, a custom keyboard, a query language you had to learn. The medium of 2026 is different. People use software on phones first. They expect natural language. They expect the interface to disappear.

Rankd is built that way. The depth and processing power of an institutional-grade tool, with the simplicity of an iPhone. The product is not the keyboard shortcut. The product is the answer.

Wider Audience, Earlier Stage

Bloomberg, in 1982, served a few thousand professionals. It took fifteen years to reach a hundred thousand seats. Rankd is being built at a moment when the addressable audience is already in the millions, and growing as fast as the markets themselves. The product has to scale not just in capability but in accessibility.

PT—06 / 06

What Comes Next

Prediction markets in 2026 are exactly where global finance was in 1982. The volume is compounding, the capital is arriving, and the friction is unbearable.

In 1982, the cost of that friction built Bloomberg.

In 2026, it builds Rankd.

If you have read this far, you already see the shift. You understand that the world’s information is being aggressively repriced in real time, and you recognize that the infrastructure required to navigate this new reality simply does not exist.

The era of trading on gut feelings, fragmented browser tabs, and delayed social sentiment is over. The institutions are already plugging in. The capital is already here. The only thing missing is the central nervous system that brings it all together.

The signal is live. The terminal is ready.

Welcome to what comes next.